Written Commentary

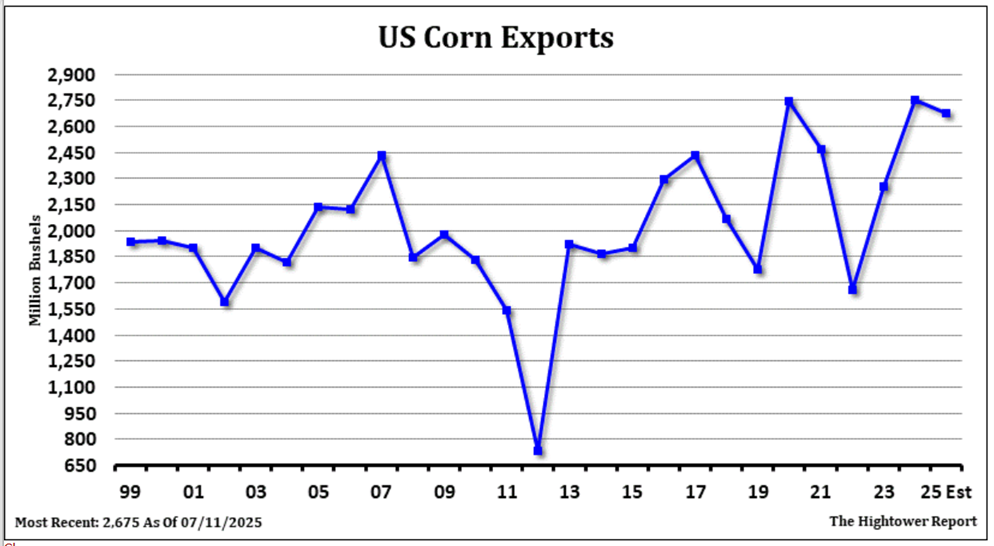
CU ended near 3.98. CU is now below all key moving averages. Volume has also slowed. Trade est US weekly old crop corn export sales at 60-350 mt vs 97 last week and new crop at 250-800 mt vs 565 last week. USDA est World exports at 192 mmt vs 192 last year. US is 69 mmt vs 57 last year. Brazil exports are est near 43 mmt vs 38 ly. USDA also est 25/26 World exports at 195 mmt. US is 67 with some as low as 61. Brazil is 43 mmt and assumes a crop at 131 mmt. Trade will be watching US tariffs especially EU and China closely.
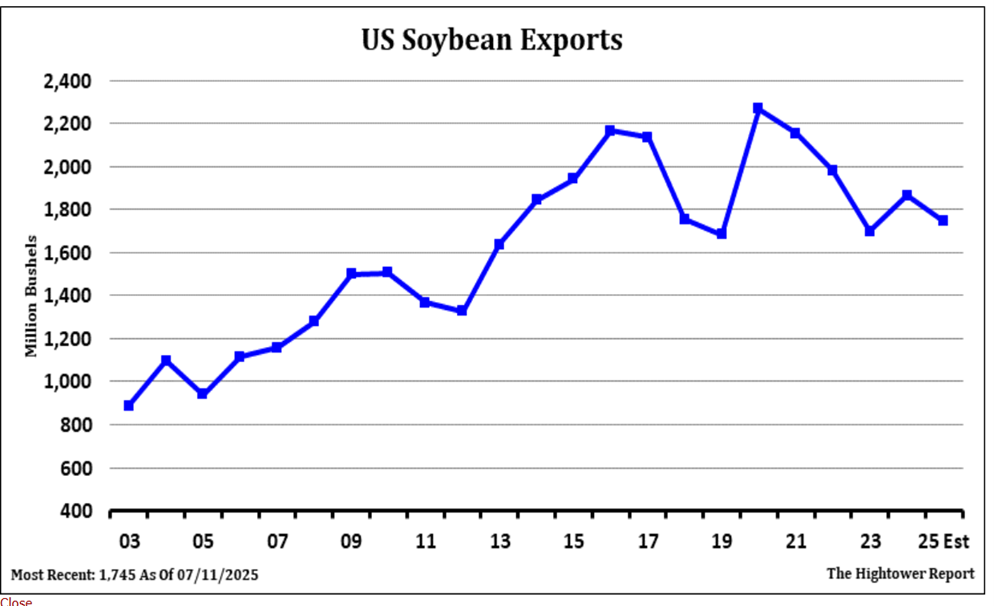
SU ended near 10.05. Soymeal is near 276. BOU is near 56 cents. World soymeal basis levels are lower on too much supply. US farmers remain reluctant sellers of new crop soybeans. SU is now below all key moving averages. Volume has increased over the last few trading days. Some look for SX to test 8.60 as harvest low as long as US Midwest weather remains favorable. Trade est US weekly old crop soybean export sales at 60-350 mt vs 97 last week and new crop at 250-800 mt vs 565 last week. USDA est World exports at 180 mmt vs 177 last year. US is 50 mmt vs 46 last year. Brazil exports are est near 102 mmt vs 104 ly. USDA also est 25/26 World exports at 187 mmt. US is 47 with some as low as 43. Brazil is 112 mmt and assumes a crop at 175 mmt. Trade will be watching US tariffs especially EU and China closely.
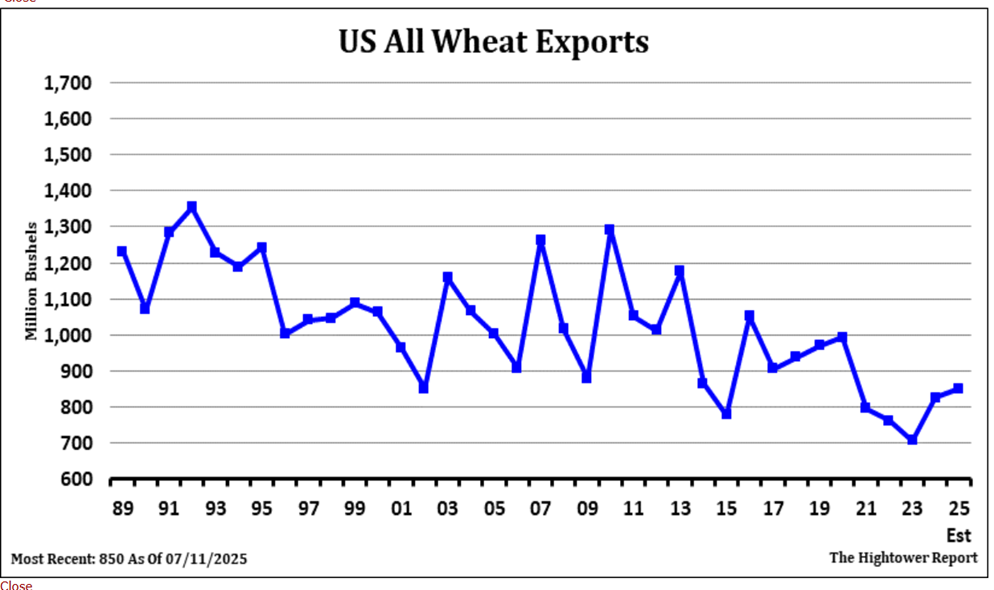
WU ended near 5.41 in mostly range bound trade and increase in open interest. KWU ended near 5.23. MWU ended near 5.86. WU is back above the 20 day moving average. Volume has increased over the last few trading days. Weekly US wheat export sales are est at 250-500 mt vs 494 last week. USDA est World wheat exports at 213 mmt vs 206 ly. US is 23 vs 22 ly. Russia is 46 mmt vs 43 ly. EU 32.5 vs 26.5 ly. Canada is 27 mmt vs 27 ly. Australia 23 vs 25.
All charts are provided by The Hightower Report.
Risk Warning: Investments in Equities, Contracts for Difference (CFDs) in any instrument, Futures, Options, Derivatives and Foreign Exchange can fluctuate in value. Investors should therefore be aware that they may not realise the initial amount invested and may incur additional liabilities. These investments may be subject to above average financial risk of loss. Investors should consider their financial circumstances, investment experience and if it is appropriate to invest. If necessary, seek independent financial advice.
ADM Investor Services International Limited, registered in England No. 2547805, is authorised and regulated by the Financial Conduct Authority [FRN 148474] and is a member of the London Stock Exchange. Registered office: 3rd Floor, The Minster Building, 21 Mincing Lane, London EC3R 7AG.
A subsidiary of Archer Daniels Midland Company.
© 2021 ADM Investor Services International Limited.
Futures and options trading involve significant risk of loss and may not be suitable for everyone. Therefore, carefully consider whether such trading is suitable for you in light of your financial condition. The information and comments contained herein is provided by ADMIS and in no way should be construed to be information provided by ADM. The author of this report did not have a financial interest in any of the contracts discussed in this report at the time the report was prepared. The information provided is designed to assist in your analysis and evaluation of the futures and options markets. However, any decisions you may make to buy, sell or hold a futures or options position on such research are entirely your own and not in any way deemed to be endorsed by or attributed to ADMIS. Copyright ADM Investor Services, Inc.