Written Commentary

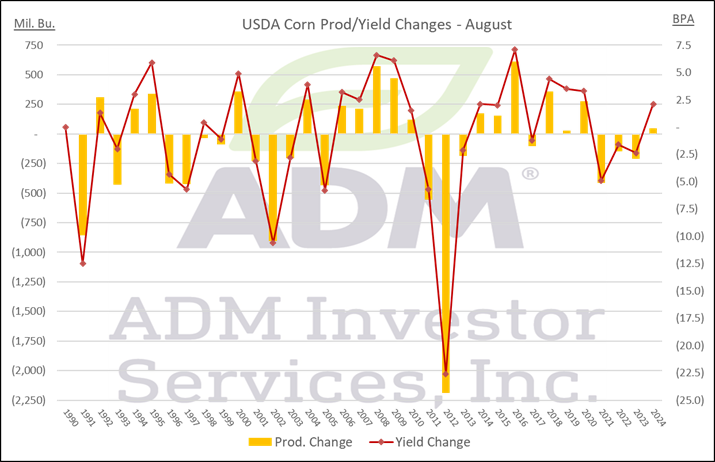
Prices were $.01-$.02 lower today. Spreads closed mixed as Sept/Dec made a new low at ($.23) with today being day 2 of the Goldman roll. Dec-25 rejected trade back above the $4.10 level today while rejecting trade below $4 earlier this week. Support rests at the CL at $3.96 ¾. The extreme heat across the S. plains and areas in the WCB will ease over the weekend with more normal readings by early next week.The USDA announced the sale of 125k tons (5 mil. bu.) of corn to an unknown buyer. Demand for US corn remains strong with old crop exports likely to rise another 25-50 mil. bu. cutting into old crop ending stocks. US corn prices remain at about a $10 per ton discount to Brazil thru Nov. A surprise given expectations for increased, possibly record production in Brazil as their 2nd crop harvest winds down. More and more of their corn is being used domestically as they expand their ethanol production. Argentine corn is 89% harvested, up only 1% for the week according to the BAGE. Since 1990 the August USDA has brought lower corn production 17 times, higher production 17 times while unchanged once. The largest increase was in 2016 when production rose 613 mil. bu. with yields surging 7.1 bpa to 175.1
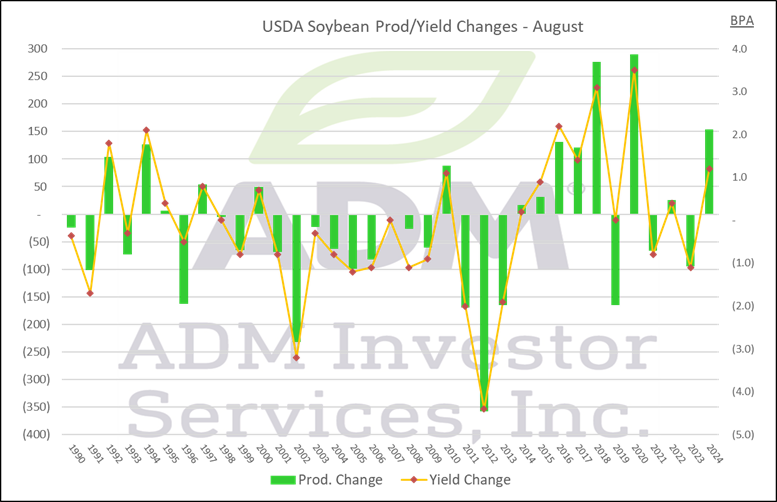
Prices were mostly lower with beans off $.05-$.07, meal was mixed and very near unchanged while bean oil backed up late closing 80-90 points lower. Beans spreads were mixed while product spreads firmed. Both Sept-25 and Nov-25 bean futures closed near session lows. Resistance for Sept-25 meal is at this week’s high at $282 with the 50 day MA just above that at $283.10. Sept-25 oil violated support at its 50 day MA at 52.88. Spot board crush margins slipped $.01 ½ to $2.20 ½ bu. with soybean oil PV falling to an 8 week low at 48.8%. New crop crush margins fell $.04 to $2.17 ½. There is potential for heavy rain and isolated flooding across areas of the NC Midwest this weekend. Powerful storms brought heavy rain, hail and potentially damaging winds overnight across North Dakota. Crop damage at this point is unknown. Week 2 of the outlook leans above to much above normal temperatures with normal to above normal precipitation.Expectations are for little change to the old crop soybean balance sheet with stocks likely hold close to 350 mil. bu. We’re slightly lower at 340 mil. looking for an uptick in crush. We look for new crop stocks to rise to 355 mil. bu. with increased production and slightly lower usage. Without a trade deal with the US, China has been actively buying soybeans and meal from SA origin, paying more than they’d likely have to for US beans. Still awaiting to see if Pres. Trump extends the current trade truce with China that expires next Tues. the day of the USDA report, or perhaps raises tariffs as they also continue to purchase Russian oil. With Brazilian soybean plantings just over a month away most forecasts are expecting acres to increase between 1–1.5% this year, among the slowest YOY growth in the past few decades. Since 1990 soybean production rose 14 times in the August USDA report while falling 20 times with 1 year unchanged. The largest increase was in 2020 when production rose 290 mil. bu. with yields surging 3.5 bpa to 53.3.
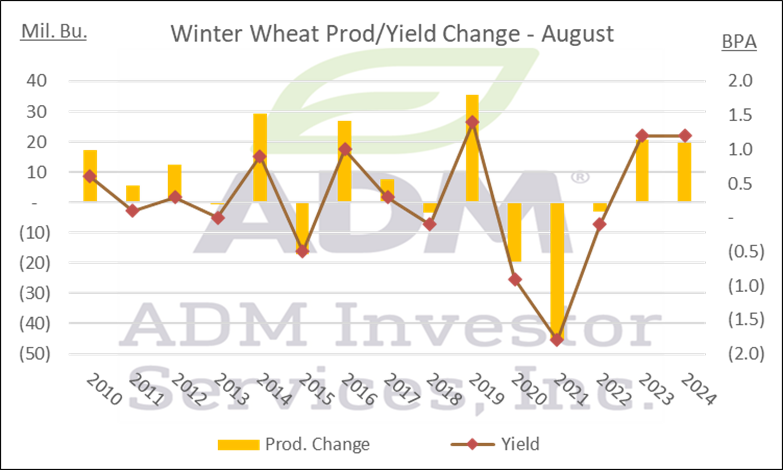
Prices ranged from $.03-$.04 lower in CGO and KC to $.03 higher in MIAX. Overnight storms with potential damage to the HRS crop providing the support for MIAX futures. Media outlets are reporting a truce deal drafted by US/Russia would enable Russia to maintain certain territories occupied in E. Ukraine. A peace summit reportedly could occur as early as next week. IKAR raised their Russian wheat production forecast .5 mmt to 84.5 mmt, just above the USDA forecast of 83.5 mmt. Ukraine’s grain harvest has reached 19.9 mmt as of Aug. 7th, of which 14.9 mmt is wheat. France’s Ag. Ministry increased their soft wheat production forecast .5 mmt to 33.1 mmt while harvest has advanced to 94% complete. In the past 15 years winter wheat production has risen in August 9 times and fallen 6 times. Largest increase was 36 mil. bu. in 2019, with the largest decrease 46 mil. in 2021.
Charts provided by QST.
Risk Warning: Investments in Equities, Contracts for Difference (CFDs) in any instrument, Futures, Options, Derivatives and Foreign Exchange can fluctuate in value. Investors should therefore be aware that they may not realise the initial amount invested and may incur additional liabilities. These investments may be subject to above average financial risk of loss. Investors should consider their financial circumstances, investment experience and if it is appropriate to invest. If necessary, seek independent financial advice.
ADM Investor Services International Limited, registered in England No. 2547805, is authorised and regulated by the Financial Conduct Authority [FRN 148474] and is a member of the London Stock Exchange. Registered office: 3rd Floor, The Minster Building, 21 Mincing Lane, London EC3R 7AG.
A subsidiary of Archer Daniels Midland Company.
© 2021 ADM Investor Services International Limited.
Futures and options trading involve significant risk of loss and may not be suitable for everyone. Therefore, carefully consider whether such trading is suitable for you in light of your financial condition. The information and comments contained herein is provided by ADMIS and in no way should be construed to be information provided by ADM. The author of this report did not have a financial interest in any of the contracts discussed in this report at the time the report was prepared. The information provided is designed to assist in your analysis and evaluation of the futures and options markets. However, any decisions you may make to buy, sell or hold a futures or options position on such research are entirely your own and not in any way deemed to be endorsed by or attributed to ADMIS. Copyright ADM Investor Services, Inc.